Knowledge · Free tool
What does reuse actually save?
Ask for an audited worksheet
Replies within one business day · Fields marked * are required
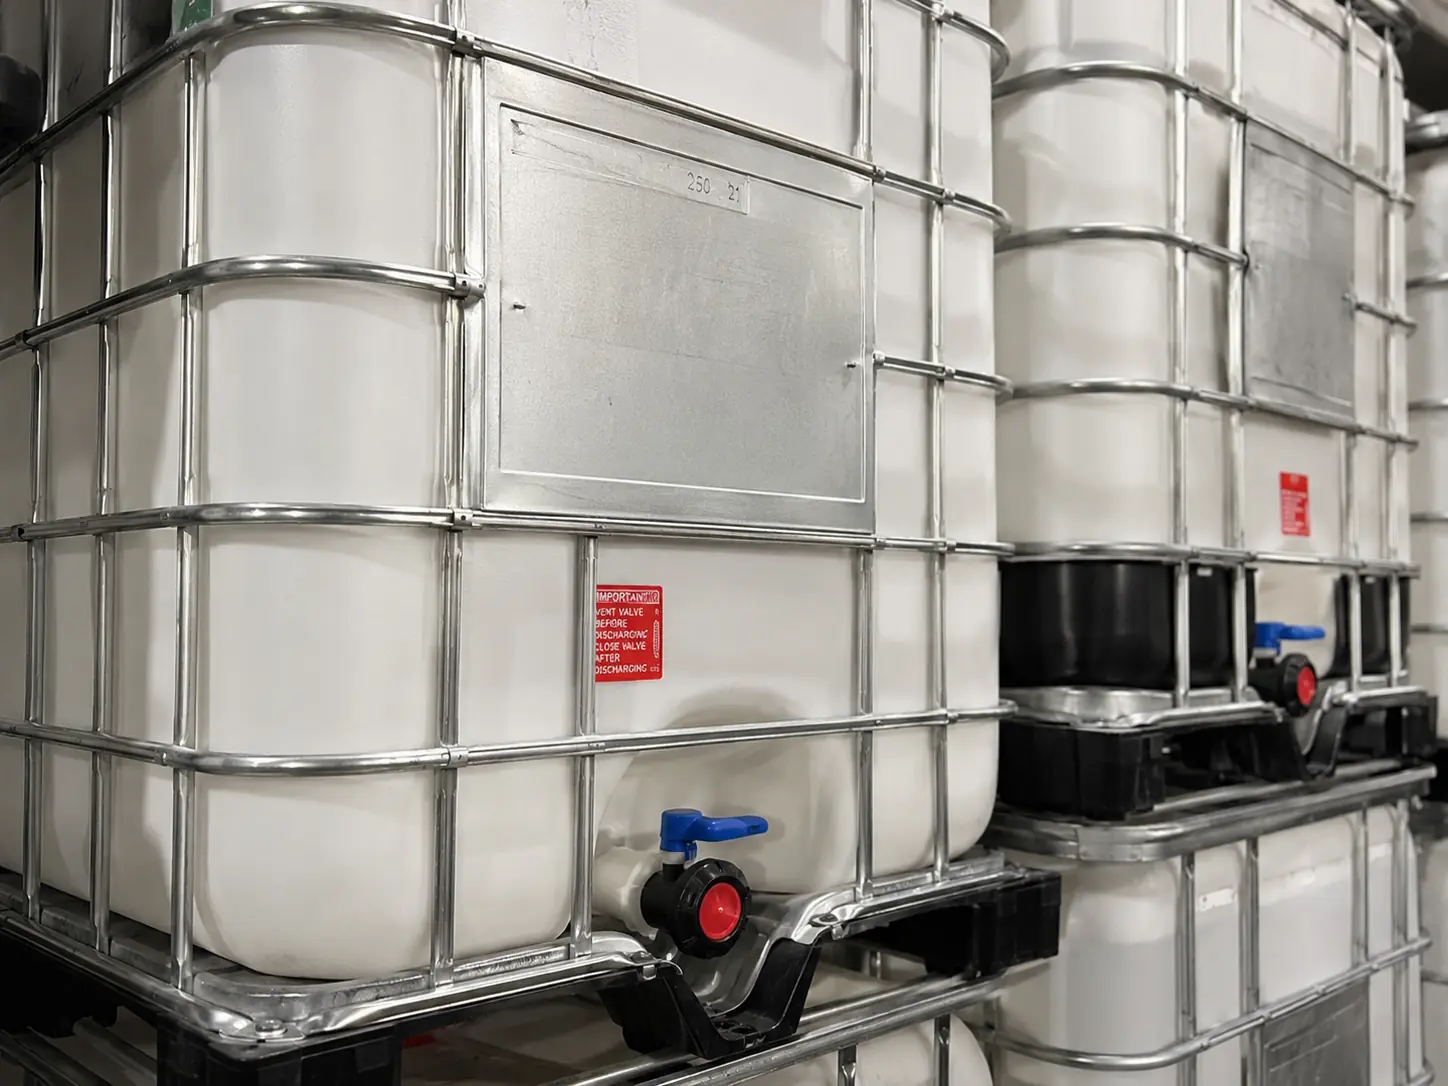
How we got there. Cradle-to-gate burden of the virgin container (17 kg HDPE at 1.9 kg CO₂e/kg, 42 kg galvanised steel at 2.2 kg CO₂e/kg) minus the real cost of bringing one back: collection, caustic wash, rinse, leak test and the return leg, about 15 kg CO₂e a unit. We round every figure down. Treat it as an order-of-magnitude guide for a sustainability report, not a verified LCA — if you need a defensible number for CDP or a Scope 3 filing, ask us for the per-shipment worksheet and we'll build it from your actual manifest.
Show your working
Where every number comes from.
If a sustainability figure cannot survive someone checking it, it should not be on a website.
| Component | Mass | CO₂e factor | Energy factor | Subtotal CO₂e |
|---|---|---|---|---|
| HDPE bottle (virgin) | 17 kg | 1.9 kg CO₂e/kg | 76 MJ/kg | 32.3 kg |
| Galvanised steel cage + frame | 42 kg | 2.2 kg CO₂e/kg | 25 MJ/kg | 92.4 kg |
| Manufacturing + inbound transport allowance | — | ~12% uplift | — | ~15 kg |
| Less: reconditioning charge | — | wash, caustic, collection, return leg | — | −15 kg |
| Net avoided (published) | — | — | — | 125 kg |
The four profiles
- Reconditioned 275 — 125 kg. Original bottle, original cage, both stay in service. The full avoided burden.
- Rebottled 275 — 78 kg. New bottle, so no resin saving. The 42 kg of steel is what you keep.
- Reconditioned 330 — 148 kg. Larger container, more material avoided: 21 kg HDPE and 48 kg steel.
- Granulated at end of life — 46 kg. Material is recovered but the manufacturing energy is spent again. This is why recycling sits fourth on our ladder.
What is deliberately excluded
Offsets. Renewable energy certificates. Double-counting a container as both a reuse saving and a recycling credit. Downstream benefits when a customer uses a tote for something greener than its previous contents — that saving is theirs. Containers we merely transported for a third party.
Equivalences, and why they are approximate
The “miles driven” and “bathtubs” figures exist to make a number legible to somebody who does not work in kilograms of CO₂e. They use 0.4 kg CO₂e per mile for an average US passenger car, 21 kg sequestered per mature tree per year, 29 kWh per average US household per day, and 150 litres per bath. They are illustrative, not auditable — use the primary figures for anything that matters.
Can I use these figures in a sustainability report?
For an internal report or a directional claim, yes — the factors are published and conservative. For a CDP submission, a Scope 3 line item or a customer audit, ask us for a per-shipment worksheet built from your actual manifest instead. Averages are fine for orientation and not fine for filing.
Why is the rebottled saving lower than reconditioned?
Because a rebottled unit uses a brand-new bottle, so you are still paying for 17 kg of virgin HDPE. You keep the 42 kg of steel in service, which is where the 78 kg comes from. If your job tolerates a used bottle, reconditioning is both cheaper and greener.
Do you count offsets or renewable energy certificates?
No. Everything here is avoided burden — emissions that did not happen because a container was not manufactured. We do not net anything off with purchased instruments, and we do not claim carbon neutrality.
What's the biggest source of uncertainty?
The assumed tare split between HDPE and steel, which varies by manufacturer and pallet type. Treat everything as ±15%. We round every component down, so the true figure is more likely above these numbers than below.
Need something an auditor will accept?
We build per-shipment worksheets from your real manifest — actual containers, actual distances, actual wash cycles. Ask and we'll put one together.