Our story · Annual report
2025, in numbers we can defend.
Ask for the methodology
Replies within one business day · Fields marked * are required
Where the containers went
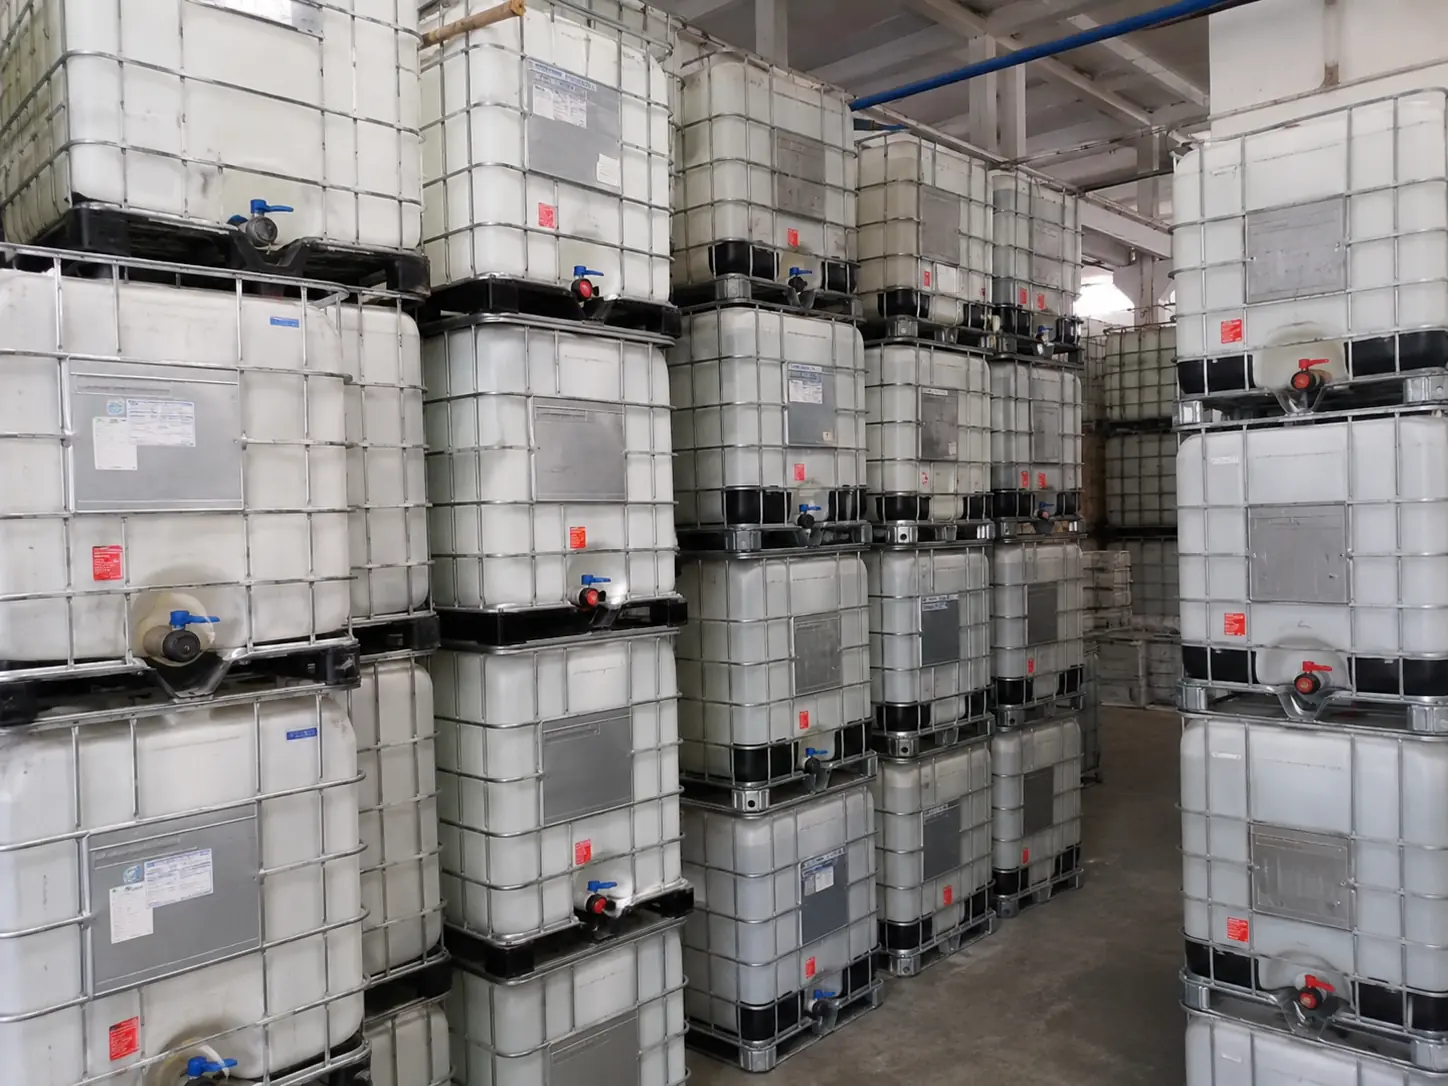
41,200 in, and what happened to each one.
| Outcome | Containers | Share | CO₂e avoided per unit | Total CO₂e avoided |
|---|---|---|---|---|
| Reconditioned and reissued | 28,430 | 69.0% | 125 kg | 3,554 t |
| Rebottled | 4,530 | 11.0% | 78 kg | 353 t |
| Stripped for parts | 1,650 | 4.0% | ~95 kg (est.) | 157 t |
| Granulated and smelted | 6,180 | 15.0% | 46 kg | 284 t |
| Upcycled | 330 | 0.8% | 125 kg | 41 t |
| Landfilled (residue) | 80 | 0.2% | 0 kg | 0 t |
Totals do not sum to 5,150 t from this table alone: the balance is rental cycles, where a single container serves multiple jobs and the saving is counted per cycle rather than per unit.
Material recovery
What came out of the granulator.
| Stream | Tonnes | Destination | Recovery rate |
|---|---|---|---|
| HDPE regrind | 105 t | Non-food durable goods manufacturers | 97% |
| Galvanised steel | 260 t | Regional mill | 99% |
| Mixed hardware (valves, fittings) | 9 t | Metal and polymer separation | 78% |
| Gaskets and seals | 1.4 t | Rubber recovery | 41% |
| Wooden pallet bases | 18 t | Biomass | 100% |
| Non-recoverable residue | 3.1 t | Permitted disposal | — |
Weighted material recovery across all end-of-life containers: 94.1% by mass. The gasket figure is the worst on the sheet and it is a genuinely hard problem — small, mixed-polymer, chemically contaminated parts have almost no recovery market.
What got worse
Three numbers we are not pleased with.
An annual report that improves in every category is not a report, it is a brochure.
Reuse rate fell two points
From 71% to 69%. The cause is volume growth in the wrong mix: we took on two large industrial clearances whose containers were in materially worse condition than our usual intake. The absolute number of reused containers went up; the percentage went down. We report the percentage because the percentage is the honest measure of how well we are triaging.
Collection miles per container rose 7%
We accepted more small lots outside the dense metro core, which is good for customers and bad for the emissions denominator. Consolidating those runs better is the main operational target for 2026.
Gasket recovery is still 41%
Unchanged for three years. Small mixed-polymer parts with chemical contamination have no viable recovery market at our volume. We have not solved this and we are not going to pretend a 1.4 tonne stream is immaterial just because it is small.
Method, briefly
Avoided emissions are calculated as the cradle-to-gate embodied burden of the virgin container a customer did not have to buy, minus the burden of the service we performed. Factors: virgin HDPE at 1.9 kg CO₂e/kg, virgin galvanised steel at 2.2 kg CO₂e/kg, reconditioning charge at 15 kg CO₂e per unit. Full derivation is on the environmental mission page.
What we exclude. We do not count offsets. We do not claim a recycling credit and a reuse credit on the same container. We do not claim downstream benefits when a customer uses a tote for something greener than its previous contents — that saving belongs to them. We do not count containers we merely transported for a third party.
Uncertainty. Treat everything here as ±15%. The largest source of error is the assumed tare split between HDPE and steel, which varies by manufacturer. We round every component down, so the true figure is more likely above these numbers than below — but we would rather be quietly conservative than loudly wrong.
These figures have not been third-party verified. If you need something that has been, tell us and we will build a per-shipment worksheet from your actual manifest that an auditor can follow line by line.
Where do the carbon factors come from?
They are published alongside the figures so anyone can check the arithmetic — 125 kg CO₂e avoided per container reused, 46 per container recycled. We round every component down, so the true figure is more likely above ours than below.
Have these numbers been third-party verified?
No, and we say so rather than implying otherwise. If you need verified figures, tell us and we will build a per-shipment worksheet from your actual manifest that an auditor can follow line by line.
Why is reuse counted so much higher than recycling?
Because reuse avoids manufacturing an entire replacement container. Recycling recovers the material but still requires the new object to be made, so the avoided burden is roughly a third of what reuse saves.
Can I use these figures in my own sustainability report?
Better than that — send us your real manifest and we will build the numbers from your containers, distances and wash cycles rather than from our yard-wide averages.
Does the report cover things that went badly?
Yes. A report that only lists improvements is marketing. We publish what got worse alongside what improved, because the figures are only useful to anyone if the bad years show up too.
Need these numbers for your own report?
We'll build a per-shipment worksheet from your real manifest — containers, distances and wash cycles, not averages.